

The most fundamental goal of the Opportunity Zone program is the revitalization of areas in the country that have long been neglected. The theory is that in order for these areas to truly be revitalized, transactions occur and there is an influx of capital that will ultimately lead to growth. From the investor’s perspective this makes sense, as the structure of the program provides for generous incentives, yet stringent requirements, most notably the ten-year hold period. For current owners of assets within the census tracts however, the question continues to be, what benefit do I and my community receive? While it is too early in the program to make a final determination, trends have already been established and we can assess how the program has impacted the market and these owners so far.
Providing clients with a realistic valuation of their asset is one of the most critical aspects of deal making. It establishes trust and expectations for the next several months before the deal is ultimately executed. With the introduction of the Tax Cuts and Jobs Act of 2017 and subsequent sets of guidance provided by the IRS, owners have been inundated with information by brokers, attorneys, accountants and the like. While the vast majority of said information is focused on Qualified Opportunity Funds and Qualified Opportunity Zone Businesses in an effort to provide guidance on how to take advantage of and stay within the program’s parameters, there is one group that the information routinely ignores: Current owners of the assets.
Speaking with ownership groups daily, it is clear that they have as many, if not more, questions about the program and how they may take advantage. Such inquiries range from “Does my property qualify for the program?” to “What do I do with my gains once I sell?” and everything in between. Often, the property has been in the family for generations or is owner occupied by a business owner far more occupied with running his day to day operation than understanding all of the nuances of a recently passed legislation. However, once they are made aware that their property sits within an Opportunity Zone, one question always rises to the top. What is my property worth?
DOES INCREASED LIQUIDITY MEAN INCREASED VALUE?
Given the increased media coverage and President Trump’s push through Secretary Carson and Executive Director Turner, Opportunity Zones have become real estate’s hottest buzz words. The tax advantages for individual investors, family offices and institutions have been discussed at length and in turn have spawned the growth of hundreds of Opportunity Funds either seeking to deploy capital or in the process of raising millions of dollars. These statistics are championed by advocates for the program and justifiably so. However, there has been little analysis, outside of personal opinion, as to whether the program has begun achieving its goal of revitalizing the designated census tracts.
An analysis published by Zillow, a real estate database company, touts a 20% increase in sales prices for residential properties.[1] This is an encouraging statistic that many owners use to justify their valuations, regardless of asset type. However, on the opposite end of the spectrum, articles such as “Is anyone actually investing in Opportunity Zones?” published by Institutional Investor have just as frequently been cited to claim that the program is the most recent version of Tulip Mania.[2] In either instance, one fact that cannot be ignored is that there is an unquestionable increase in the level of interest of assets located within Opportunity Zones. But, does that increased attention create an increase in value?
IS THE OZ TAX INCENTIVE WORKING?
In order to provide validity to any analysis, it is critical to understand where the numbers are coming from and the thought process behind why they were chosen. With over 8,700 census tracts in the program, opponents have argued that the incentives are a way for the rich to become richer and that they will focus only on those sites within tracts that are already attractive to take advantage of the benefits. Others have set the bar as high as suggesting that the majority of the tracts should be revitalized in order for the program to be considered a success. While the motivations for these criticisms vary, it is important to look at both census tracts that are considered the most attractive to investors and include tracts that are not as highly coveted in the analysis.
COMPARING ATTRACTIVE OZs VERSUS LESS COVETED OZs
Develop, a firm founded by Opportunity Zone architect Steve Glickman, has established an Opportunity Zone Index that scores all 8,700 plus tracts and gives them a ranking based on projections from Esri Demographics, which is based on the U.S. Census Bureau's American Community Survey. These metrics include: 2018-2023 Population Growth Rate, 2018 Total Retail Sales, 2023 Median Household Income, 2023 Median Home Value, 2018 Bachelor's Degree Rate and 2018 Unemployment Rate. Let’s compare the Top 135 County list, focusing on the top and bottom 25 counties.
Once counties were established, CoStar and CrediFi were used to identify all sales located within Opportunity Zone tracts between Jan. 1, 2016 and present, providing eight full quarters’ pre-program and six following the passing of the legislation on Dec. 15, 2017. In an effort to expand upon the Zillow analysis, all asset types were included and all comparables regardless of price. Analysis was conducted for each individual county, as well as an aggregate of the top and bottom 25 counties ranked by Develop.
FINDINGS OF THE LIMITED COMPARISON
It was quite surprising to see what the top-rated counties produced based on the metrics. New York did not contain any counties in the top 10 and California had one in Santa Clara. While they did produce one and four additional counties respectively in the top 25, states such as Maryland, Washington and Minnesota were better represented than expected. Of the bottom end of the 135 counties, Georgia, Ohio and Alabama all had multiple counties included in the list of these 135 counties out of 3,007 counties total in the United States. The entire list was far more diverse than initially anticipated and while the more populated states on the coasts expectedly drew their fair share, the Midwest and Southwest were well represented, indicating the program may have a broader reach than initially thought.
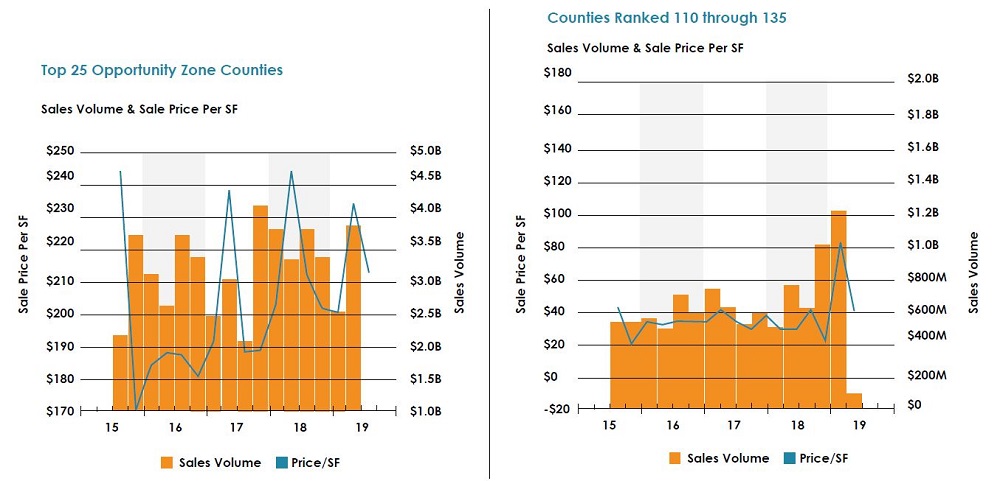
The core of the analysis was spent utilizing the data provided by CoStar and CrediFi, which included metrics such as number of transactions, sale volume, sale price, sale vs asking price and sale price per square foot. These numbers yielded a far more surprising result than county ratings. From the top 25 counties, 15,076 transactions occurred compared to 12,201 for the bottom 25 during the same time period. This includes a near 225% increase in the sales volume for the bottom 25 counties between Q2 of 2017 before the legislation was passed and the current quarter with price per square foot on a similar trajectory.
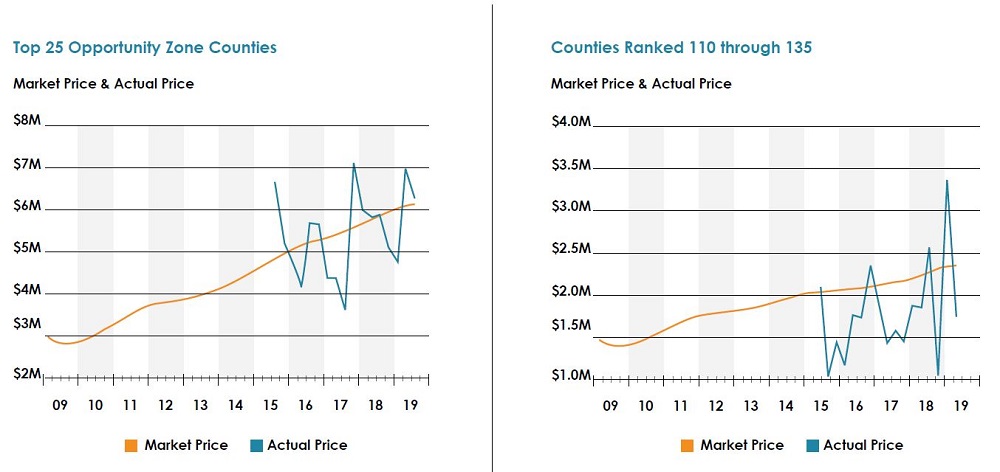
Additionally, the sale vs asking price was -9.3% for the top 25 and -10.2% for the bottom indicating that while volume ($51.9 billion vs $14.7 billion) and sale price per square foot ($201 vs $57) remained high in the more desirable counties, the ability to execute in the more suburban and rural markets is dramatically trending in the direction that the program had sought to achieve. While the top 25 counties saw a more modest increase in their market price since the legislation was passed, counties ranked from 110 through 135 saw over a 200% increase in the actual price of the assets being sold.
DATA SHOWS AN INCREASE IN VALUE FOR BOTH ATTRACTIVE AND LESS COVETED OZs
While many will point to the fact that only the top 135 counties were included, the purpose of this article was to provide a more general determination of whether or not the Opportunity Zone program is working and the correlated increase in liquidity are providing an increase in the value of a property for current owners. The answer is unequivocally yes. By how much should always be considered on an asset by asset basis, but the trend thus far is a positive one and one that should only increase as we get closer to the first deadline on Dec. 31, 2019. As we continue to evaluate the program’s level of success, the fact that the lower ranked counties saw appreciable increases in both the volume of transactions and asset value are clear evidence that the program’s mission of achieving revitalization in these areas is starting to take place.
Sources:
[1] Alexander Casey, Sale Prices Surge in Neighborhoods With New Tax Break? Zillow, Mar. 18, 2019
[2] Alicia McElhaney, “Is Anyone Actually Investing in Opportunity Zone Funds?”, Institutional Investor, May 23, 2019